
Figure 5.
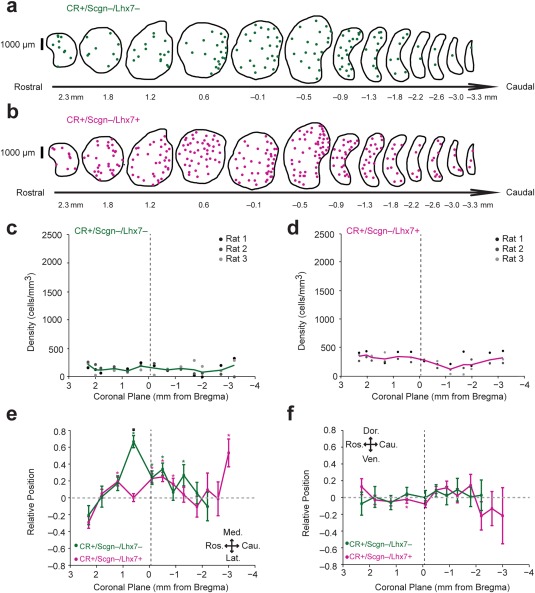
The topographical distributions of CR+/Scgn−/Lhx7− and CR+/Scgn−/Lhx7+ interneurons across the dorsal striatum of rat. (a, b) Distributions of CR+/Scgn−/Lhx7− interneurons (a) and CR+/Scgn−/Lhx7+ interneurons (b) across 13 coronal planes encompassing the rostro‐caudal axis of the dorsal striatum in a single rat, with each dot representing a single neuron. (c, d) Densities of CR+/Scgn−/Lhx7− interneurons (c) and CR+/Scgn−/Lhx7+ interneurons (d) along the rostro‐caudal striatal axis of rats. Note that both types of neurons are relatively consistent in their distribution from the rostral to the caudal pole of the striatum. (e, f) Medio‐lateral (e) and dorso‐ventral (f) distributions of CR+/Scgn−/Lhx7− interneurons (green line) and CR+/Scgn−/Lhx7+ interneurons (magenta line) along 13 coronal planes. In coronal planes where less than 5 neurons were counted per animal, no relative topographical value is given. The presence of asterisks (*) indicate a distribution that is significantly biased in one direction along the specified axis (Wilcoxon Signed Rank test). Black squares (▪; e–f) indicate a significant difference in the distribution of the two populations along the specified axis within a given coronal plane (Wilcoxon Rank Sum test). All significant values are indicated at p < .05. Data are means of the position of all neurons counted ± SEMs. (c–f) Vertical dotted line on each plot shows the position of the anterior commissure