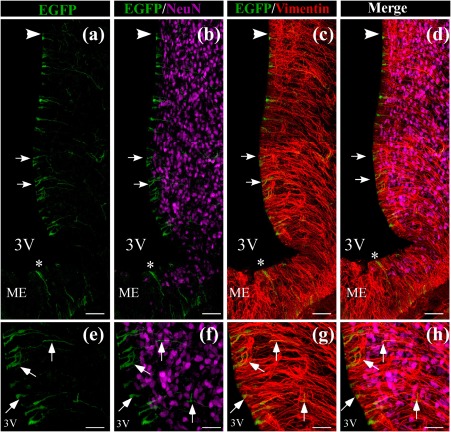
Figure 2.

Co‐distribution of EGFP in the basal hypothalamus with neuronal and glial markers. (a‐l) Frontal sections of the hypothalamus (40 µm) were analyzed using the neuronal marker, anti‐NeuN (magenta), tanycyte marker, anti‐vimentin (red), and EGFP fluorescence (green) in cells transduced with Ad‐shGLUT2 at 48 hr postinjection. (a‐d) Low magnification for EGFP, NeuN (b and d), and vimentin (c and d). (e‐h) High magnification images of EGFP in β1‐tanycytes, NeuN (f and h) and vimentin (g and h), EGFP expression is detected in cells lining the 3V and co‐localizing with vimentin (g, arrows). Co‐localization between EGFP and NeuN (b, e, j) was not detected. i‐l: More detailed images shown in g‐h. Scale bars: a‐d: 150 µm, e‐h: 50 µm, and i‐l: 30 µm [Color figure can be viewed at wileyonlinelibrary.com]
