Figure 4.

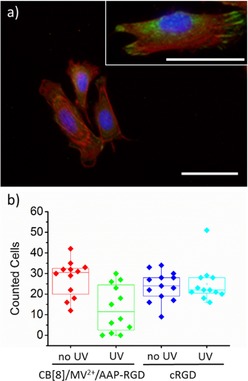
a) Fluorescence microscopy image of fixed C2C12 cells seeded for 1 h on CB[8]/MV2+/AAP–RGD SAMs. Cells were stained for nucleus (blue), actin (red) and vinculin (green), scale bar 100 μm. Inset is a magnified image of same surface, scale bar 50 μm. b) Quantitative analysis of C2C12 cells before (no UV) and after (UV) irradiation of λ=365 nm of the CB[8]/MV2+/AAP–RGD and cRGD SAMs.
