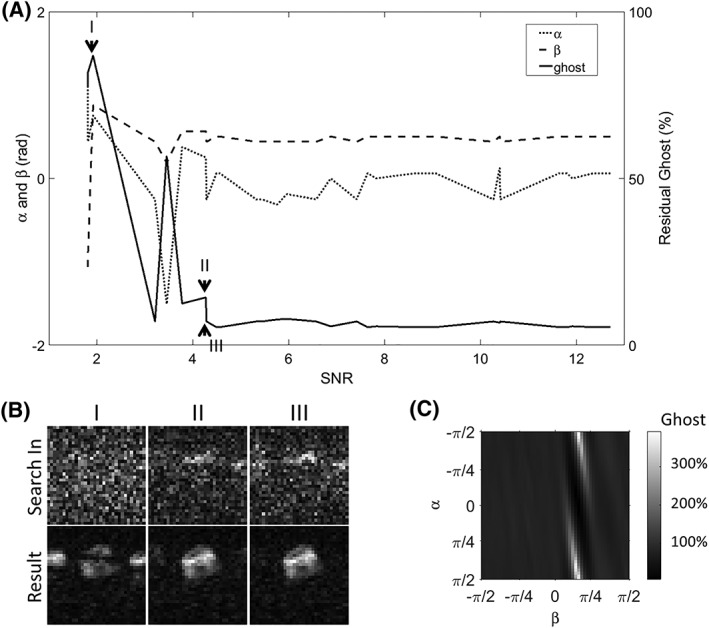
Figure 9.

A, the tolerance of the one‐dimensional (1D) search to differences in signal‐to‐noise ratio (SNR) was examined using the lactate images from one representative in vivo dataset. The search was performed on each of the lactate images (with SNRs ranging from 1.8 to 12.7) and the pair of phase correction coefficients obtained was then applied to the lactate image with the highest SNR. The resulting image was free of ghosting until the SNR of the individual lactate images was less than 4.7. The α and β pairs obtained from the searches in each image are also plotted. B, Representative lactate images with different SNRs (top row), which were used to determine α and β pairs, and the corresponding phase‐corrected lactate image with the highest SNR. C, Residual ghosting in the same image when corrected using different pairs of phase correction coefficients
