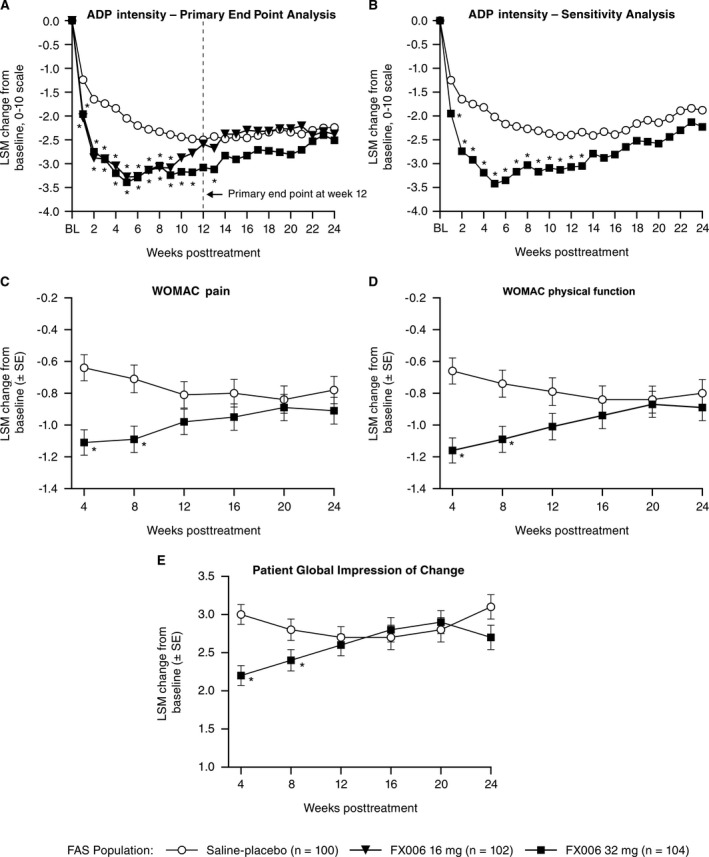
Figure 2.

A, Least squares mean (LSM) change from baseline (BL) in weekly mean average daily pain (ADP) intensity scores at the primary end point at week 12 and key secondary end points at weeks 16, 20, and 24 (observed data; mixed model for repeated measures). B, Sensitivity analysis of ADP intensity (imputed data; last observation carried forward/baseline observation carried forward). C, Western Ontario and McMaster Universities Osteoarthritis Index (WOMAC) pain subscale. D, WOMAC physical function subscale (key secondary end point at week 12). E, Patient Global Impression of Change score (key secondary end point at week 12) through week 24. FAS = full analysis set. Values are the LSM ± SEM. * = P < 0.05.
