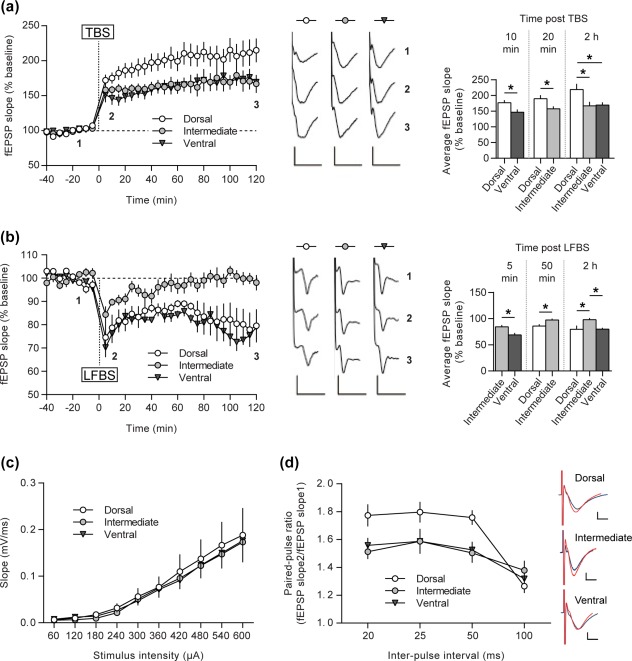
Figure 4.

Dorsal, intermediate, and ventral parts of the CA1 differ in their ability to express LTP and LTD forms of synaptic plasticity. (a) TBS‐induced LTP persisted for over 2 h. LTPs of intermediate and ventral groups were comparable, but significantly lower in magnitude as opposed to the dorsal CA1 group. Induction (10‐ and 20‐min postTBS) as well as maintenance phases of LTP (2‐h postTBS) were significantly higher in the dorsal CA1. (b) LFBS induced equivalent LTD in both dorsal and ventral slice groups and only STD in the intermediate CA1. The initial depression was significantly different between the intermediate and ventral domains (5‐min postLFBS). Fifty minutes after the onset of depression in the intermediate group it has declined to the baseline level and remained there as shown 2‐h‐postLFBS. Representative fEPSP traces at the indicated time‐points in the graph, are shown. (c) I/O relationship does not differ between any of the hippocampal subdivisions. (d) Paired‐pulse responses facilitate greater for the DH at 20–50 ms intervals as opposed to the ventro‐intermediate two‐thirds. Typical fEPSP traces in response to paired‐pulse stimulation with a 20 ms interval are shown on the right side. Here, the blue line is response to the first pulse, while the red line is response to the second pulse. Error bars indicate SEM. *p < .05. Scale bars: 0.5 mV, 10 ms for LTP, 0.25 mV, 5 ms for LTD and 0.5 mV, 1 ms for paired‐pulse responses [Color figure can be viewed at wileyonlinelibrary.com]
