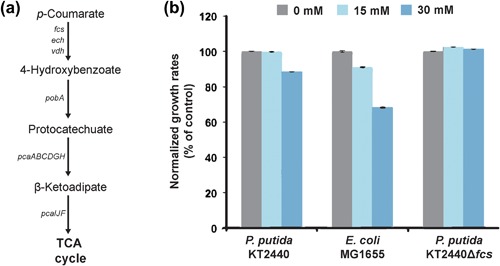
Figure 2.

(a) Degradation pathway of p‐coumaric acid in P. putida KT2440 ending in the tricarboxylic acid (TCA) cycle. (b) Growth rates of P. putida KT2440, E. coli K‐12 MG1655, and P. putida KT2440 Δfcs when exposed to different concentrations of p‐coumaric acid. Growth rates were normalized to the growth rate in control conditions without p‐coumaric acid. Error bars indicate the standard deviation of four different biological replicates
