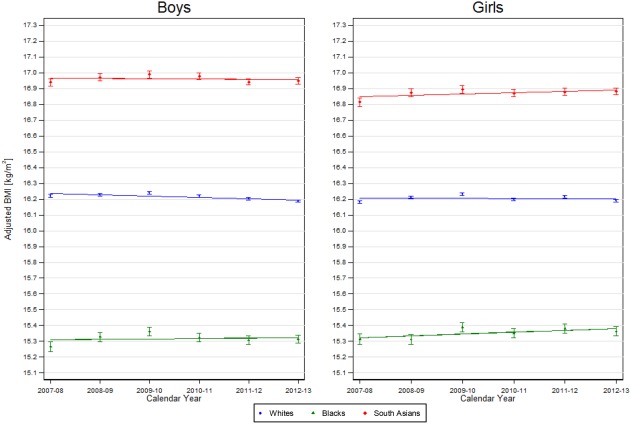
Figure 1.

aBMI for 4‐ to 5‐year‐old children in each major ethnic group between 2007‐2008 and 2012‐2013 by sex. Lines represent mean annual change in BMI in each ethnic group across the 6 years from age group and sex‐stratified regression models of aBMI against ethnic group, an interaction between ethnic group and year and age (continuous). Points and corresponding 95% CIs show the mean aBMI level (age adjusted) for each school year.
