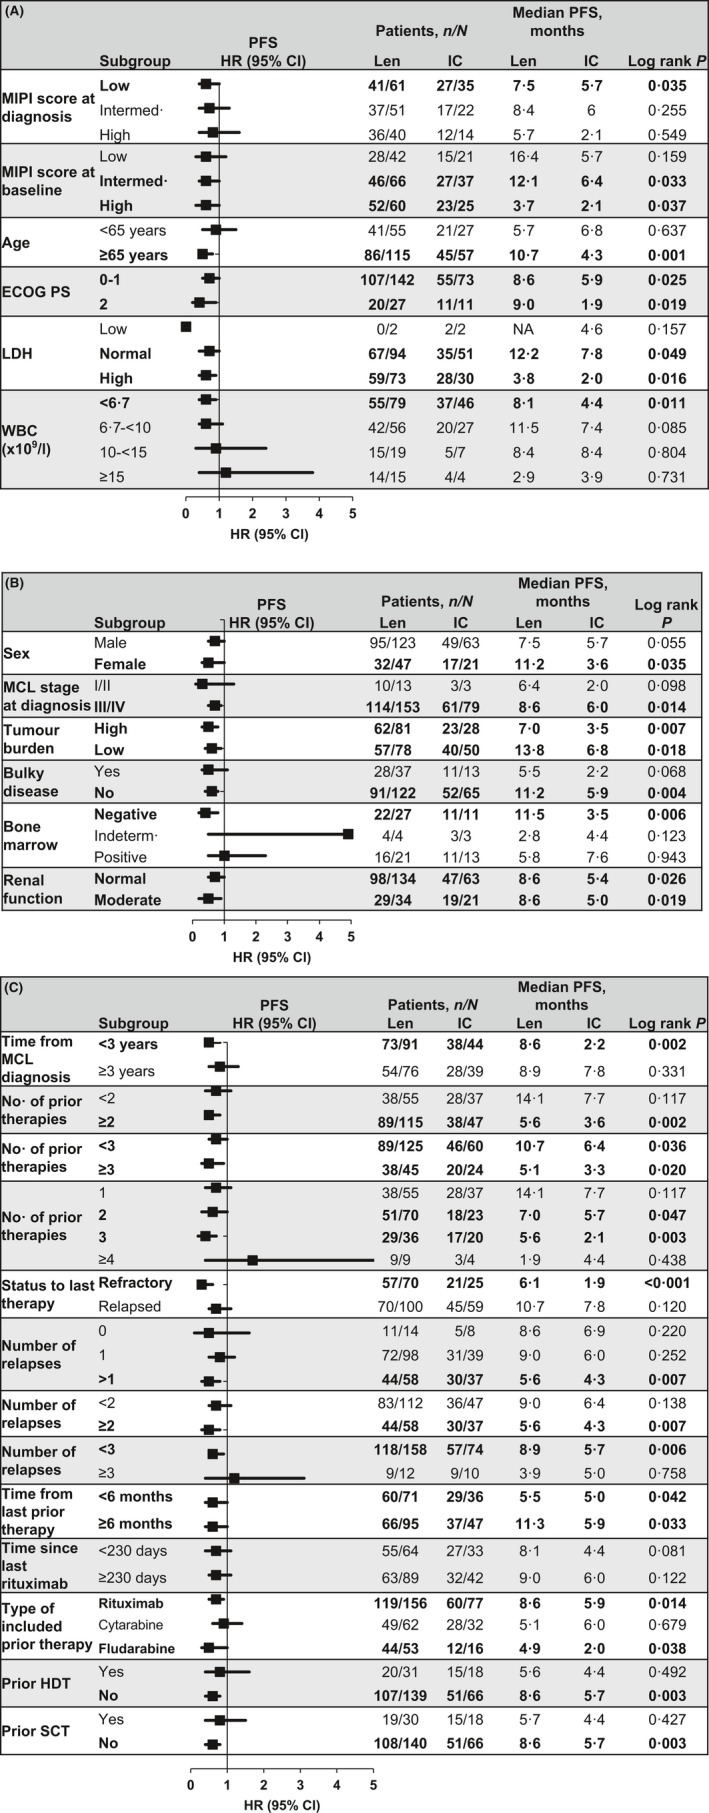
Figure 2.

Forest plots of treatment effects on median PFS by subgroups according to MIPI‐based characteristics (A), other patient characteristics (B), and prior treatment history (C). Improved PFS to the left of the vertical line (i.e., at 1) favours lenalidomide and to the right of the line favours IC. Black squares represent the HR; horizontal lines lines represent 95% CI. Statistically significant (P ≤ 0·05) values and the specified factors are shown in bold. 95% CI, 95% confidence interval; ECOG PS, Eastern Cooperative Oncology Group performance status; HR, hazard ratio; IC, investigator's choice; Intermed., intermediate; LDH, lactate dehydrogenase; Len, l lenalidomide; MCL, mantle cell lymphoma; MIPI, MCL International Prognostic Index; PFS, progression‐free survival; SCT, stem cell transplantation; WBC, white blood cell count.
