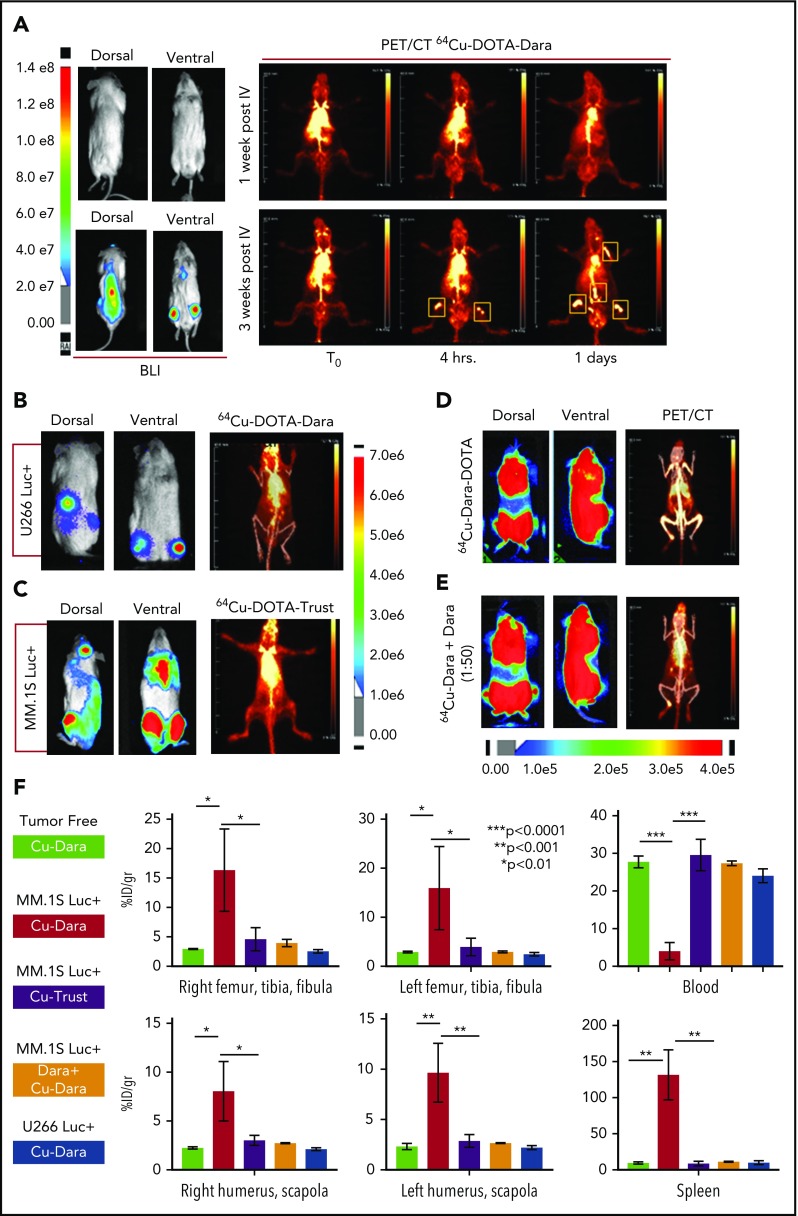
Figure 1.
64Cu-DOTA-Dara detects MM cell dissemination in vivo. (A) The radiolabeled antibody 64Cu-DOTA-Dara (3.7 MBq, 10 µg) was administered to 3 mice that had been transplanted by IV injection with a human MM cell line (MM.1S GFP+/Luc+) before (7 days post-IV) and after (21 days post-IV) signs of MM bone metastasis as detected by BLI. The mice were also imaged with 64Cu-DOTA-Dara radiolabeled antibody on the following days, and PET imaging identified MM cell dissemination in the bone (yellow boxes), which overlap with the BLI signals in the same mouse. (B) 64Cu-DOTA-Dara (3.7 MBq, 10 µg) was also administered to 2 mice that had been transplanted by IV injection with U266 Luc+ MM cells, when clear signs (5 weeks post-IV) of MM bone engraftment were detected by BLI. The mice were imaged with 64Cu-DOTA-Dara radiolabeled antibody after 1 day from the radiolabeled Dara injection (see also supplemental Figure 4B). Of note, no sign of engraftment was observed by PET/CT scan. (C) 64Cu-DOTA-trastuzumab (64Cu-DOTA-trast) (3.7 MBq, 10 µg) was administrated to 3 MM.1S GFP+/Luc+–engrafted mice, as assessed by BLI imaging, and a PET/CT scan was performed 1 day after 64Cu-DOTA-trast injection. No bone signals were observed, but only high background associated with the circulating radiolabeled antibody. (D-E) Mice bearing CD38+ MM cells (MM.1S GFP+/Luc+) with a high level of engraftment (see also supplemental Figure 4C), as assessed by BLI images, that were injected with 64Cu-DOTA-Dara (3.7 MBq, 10 µg) without (D) and with (E) unlabeled Dara (500 µg) and imaged at day 1 by PET/CT. Almost no signs of engraftments were detected in the presence of cold Dara, independent of the BLI signals. (F) 64Cu-DOTA-Dara PET/CT-positive mice (MM.1S GFP+/Luc+–engrafted mice: 4) and negative mice (tumor free mice: 4); 64Cu-DOTA-trast–treated mice (3); unlabeled Dara (Block) treated mice (2); and U266-engrafted mice (2) were sacrificed, and organs were harvested at 24 hours and used for γ counting to determine their radioactive content, as is presented in the bar graphs as a percentage of the injected dose per gram (%ID/g). See also supplemental Figure 5A.

