
Figure 3.
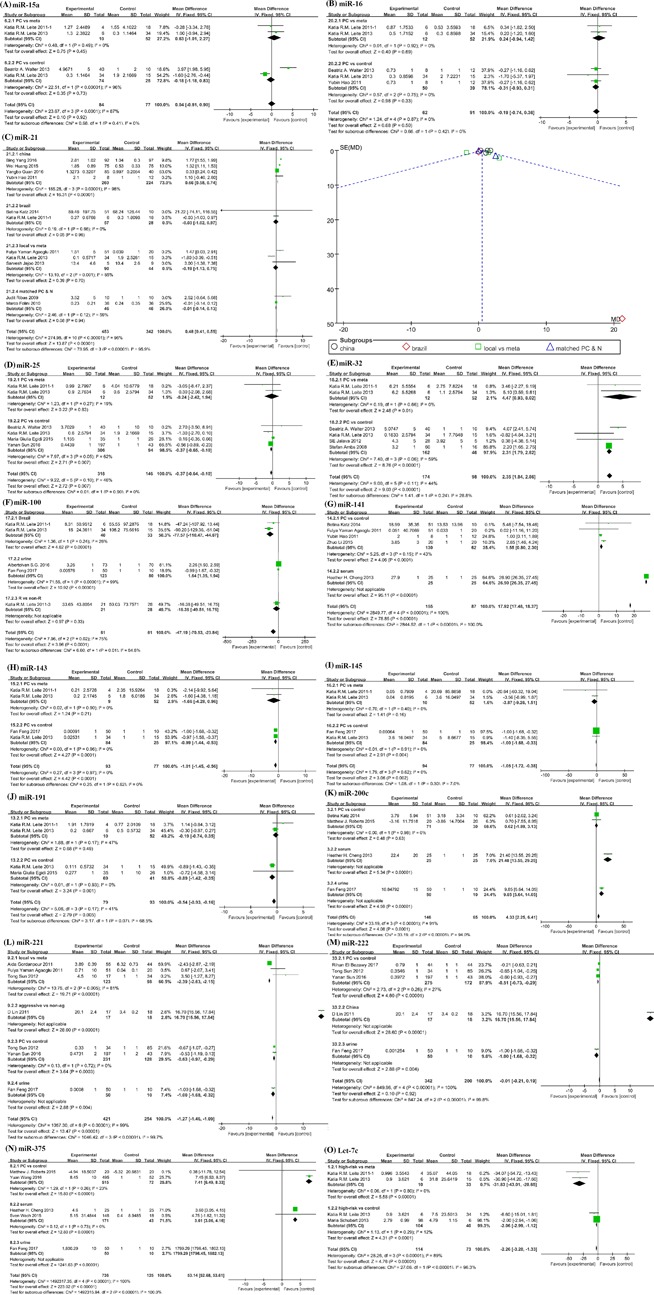
Forest plots of subgroup analyses stratified by ethnicities; main pathologic types and detected samples; showing mean expression levels or fold change with corresponding heterogeneity statistics. (A) miR‐15a; (B) miR‐16; (C) forest plot and funnel plot of miR‐21; each point represents a separate study for publication bias test in funnel plot; (D) miR‐25; (E) miR‐32; (F) miR‐100; (G) miR‐141; (H) miR‐143; (I) miR‐145; (J) miR‐191; (K) miR‐200c; (L) miR‐221; (M) miR‐222; (N) miR‐375; (O) let‐7c. Squares and horizontal lines correspond to study‐specific HRs and 95% CIs; respectively. The area of the squares correlates the weight of each enrolled study and the diamonds represent the summary HRs and 95% CIs