
Figure 5.
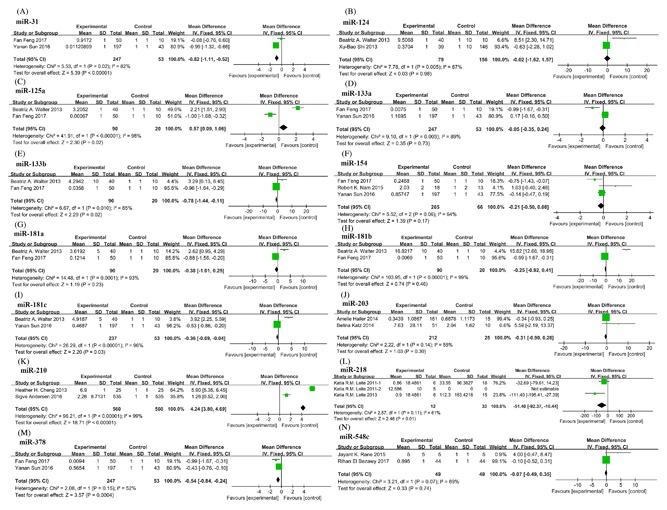
Forest plots showing mean expression levels of miRNAs with significant heterogeneity. (A) miR‐31; (B) miR‐124; (C) miR‐125a; (D) miR‐133a; (E) miR‐133b; (F) miR‐154; (G) miR‐181a; (H) miR‐181b; (I) miR‐181c; (J) miR‐203; (K) miR‐210; (L) miR‐218; (M) miR‐378; (N) miR‐548c. Squares and horizontal lines correspond to study‐specific HRs and 95% CIs; respectively. The area of the squares correlates the weight of each enrolled study and the diamonds represent the summary HRs and 95% CIs