
Figure 6.
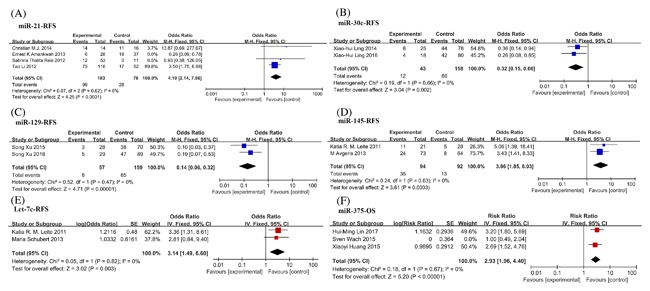
Forest plots for merged analyses of recurrence‐free survival (RFS) and overall survival (OS) associated with different miRNAs expression. Forest plots for RFS analyses of (A) miR‐21 (B) miR‐30c; (C) miR‐129; (D) miR‐145; (E) let‐7c; (F) Forest plots of OS analyses of miR‐375. Squares and horizontal lines correspond to study‐specific HRs and 95% CIs; respectively. The area of the squares correlates the weight of each enrolled study and the diamonds represent the summary HRs and 95% CIs