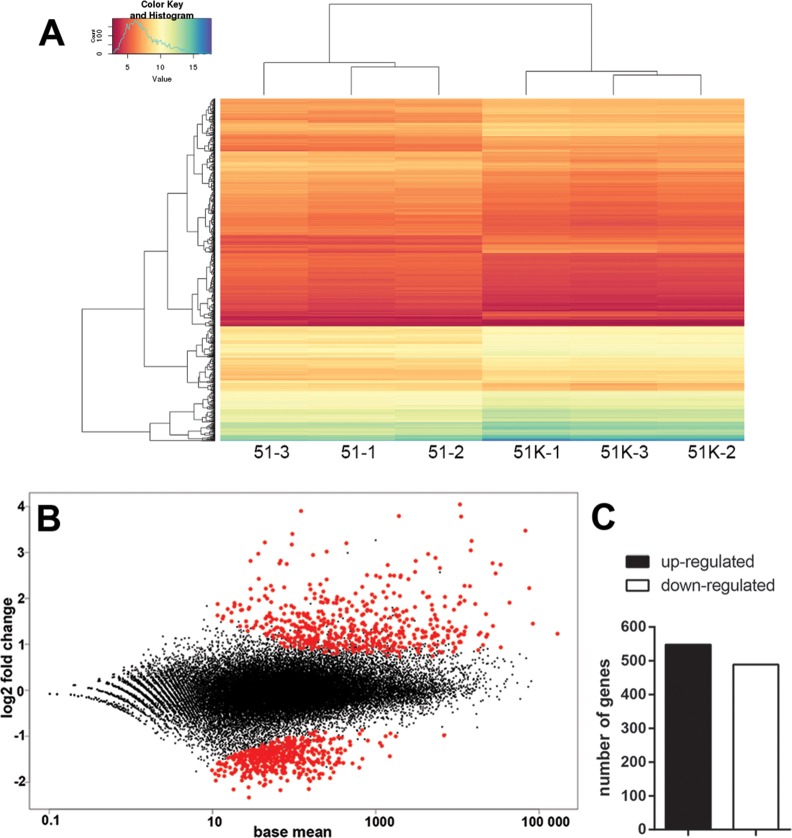
Fig. 3.
—Gene expression in Paramecium tetraurelia 51K infected with Caedibacter taeniospiralis compared with symbiont-free line 51. (A) Hierarchical clustering of gene expression values (logTPM) in rows and columns for all six samples. (B) MA plot of log2 fold change of gene expression level (y-axis) against mean gene expression level (x-axis). Each point represents a gene; those with significant differential expression (FDR ≤0.01) are indicated in red. (C) Bar plot of DEGs in 51K with the number of up- and down-regulated genes, in black and white respectively.

