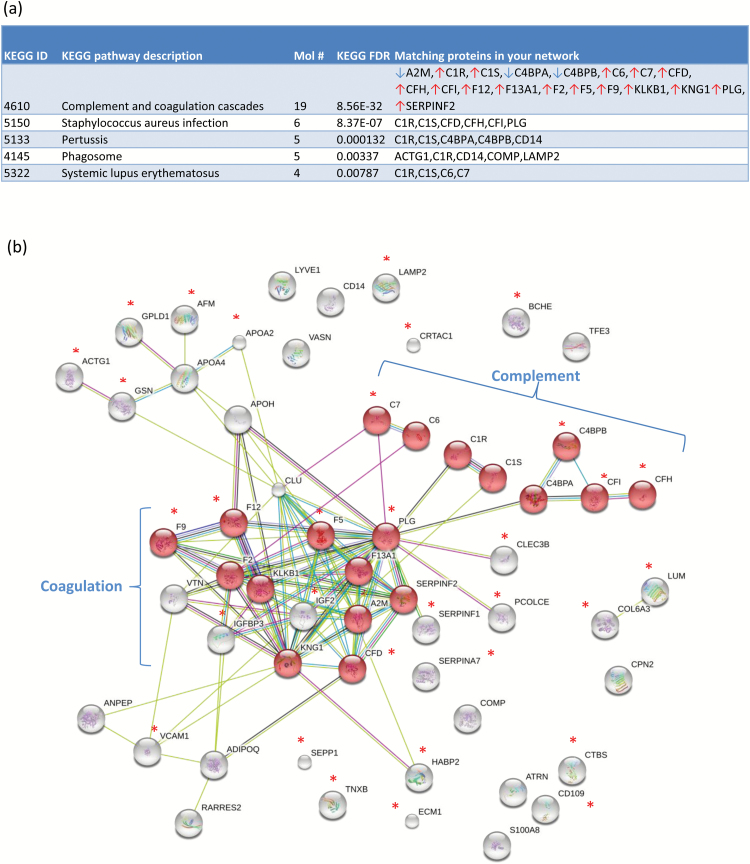
Fig. 1.
Differentially expressed proteins converge on complement and the coagulation cascade. (a) KEGG pathway analysis 60 proteins as differentially expressed between cases (n = 37) and controls (n = 38) identified the complement and coagulation cascade as the top process implicated (19 proteins; false discovery rate (FDR) 8.56e-32; (b) STRING network analysis provided strong evidence for co-regulation among coagulation and complement proteins, with the average interactions per protein being 3.65 (ie, average node degree) for 57 of the 60 proteins mapped. Proteins that were significant at the FDR level are marked with asterisks.

