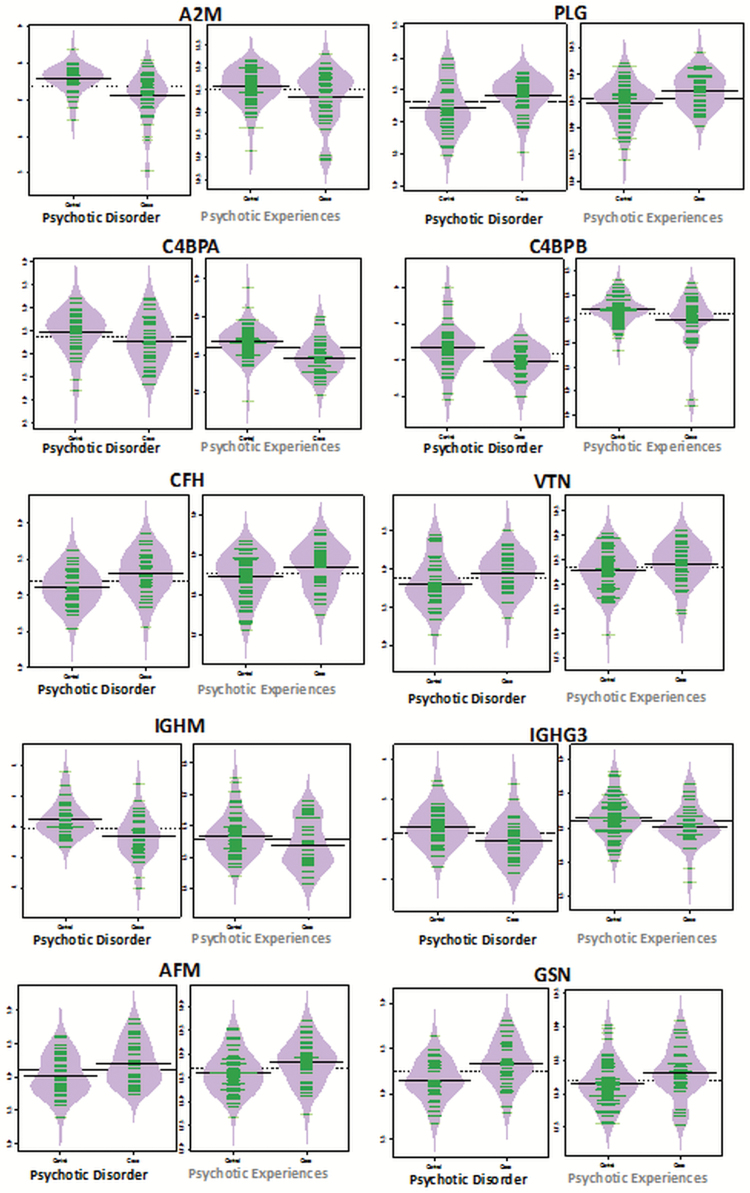
Fig. 2.
Bean plots of proteins identified as altered in the same direction in both the psychotic disorder (PD) and psychotic experience (PE) cohorts. Bean plots represent the log-transformed intensities in protein expression (y-axis) between cases and controls (x-axis) for both the PD (n = 75) discovery proteomic analysis (left), and PE (n = 106) hypothesis-driven proteomic analysis (right). Please note the scale on the y-axis differs between the PD and PE cohorts because different quantification methods were used to assess protein expression in each cohort (ie, DDA vs DIA data). Nevertheless, bean-plots representing the expression changes in complement and coagulation proteins (A2M, PLG, C4BPA, C4BPB, CFH, and VTN), and others (IGHM, IGHG3, GSN, and AFM) are altered in the same direction in both cohorts. These protein candidates may represent persistent early hallmarks of psychotic outcomes at age 18 in the general population.

