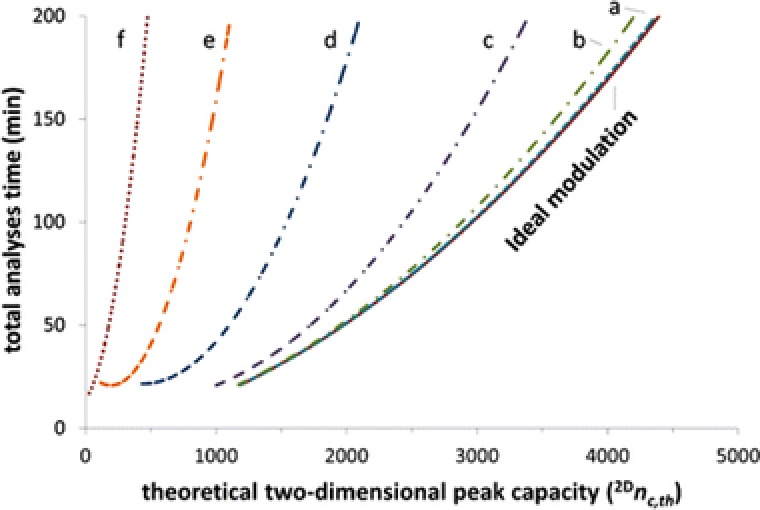
Figure 6.

Pareto‐optimal fronts of theoretical peak capacity versus total analysis time column diameter ratios (2 d c/1 d c ) of (a) 7 (partly obscured by the drawn line representing ideal modulation), (b) 4, (c) 2, (d) 1, (e) 0.5, and (f) 0.25. Reprinted with permission from 56. Copyright 2017, American Chemical Society
