Figure 13.

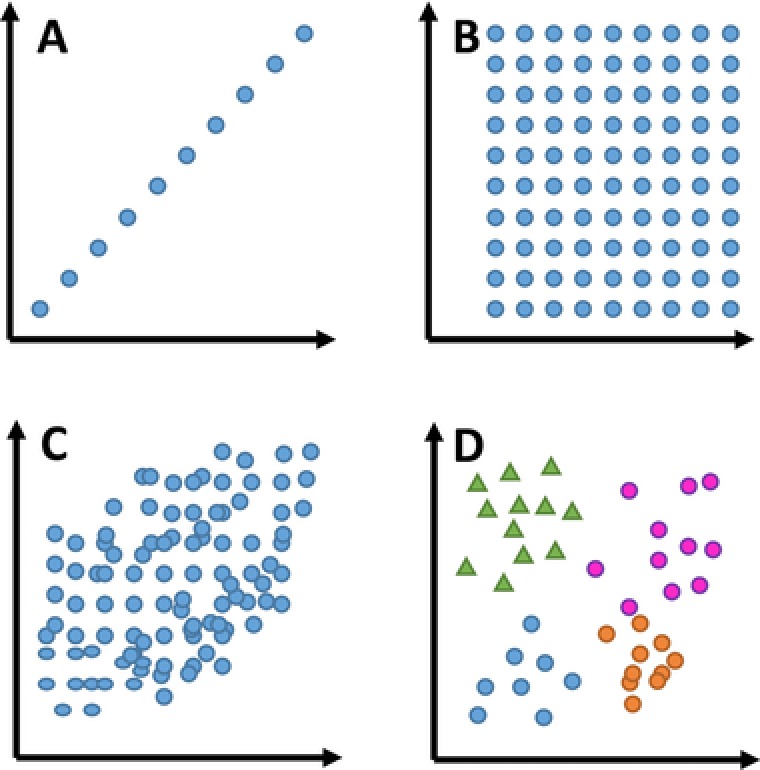
Hypothetical examples of different distributions of peaks across the 2D separation plane in LC × LC separations. In (D), the different colours and shapes represent different classes of compounds separated as in a group‐type separation

Hypothetical examples of different distributions of peaks across the 2D separation plane in LC × LC separations. In (D), the different colours and shapes represent different classes of compounds separated as in a group‐type separation