
Figure 16.
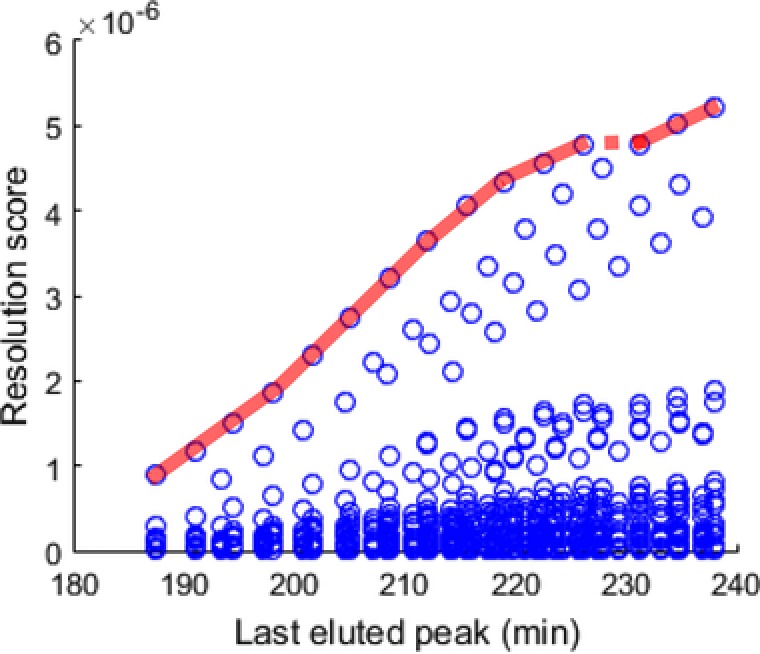
Example of a Pareto‐optimality (PO) plot with each point representing one of the 10 368 evaluated simulated LC × LC separations of a mixture of aged, synthetic dyes. The PO front (in red) reflects all PO points in the plot. For these points the two plotted criteria may not both be improved simultaneously. See Supporting Information S3 for a more detailed clarification on the chromatographic conditions, analyte mixture, and the optimization parameters used to arrive at this PO‐plot. Plot created using the Program for Interpretive Optimization of 2D Resolution (PIOTR) 187