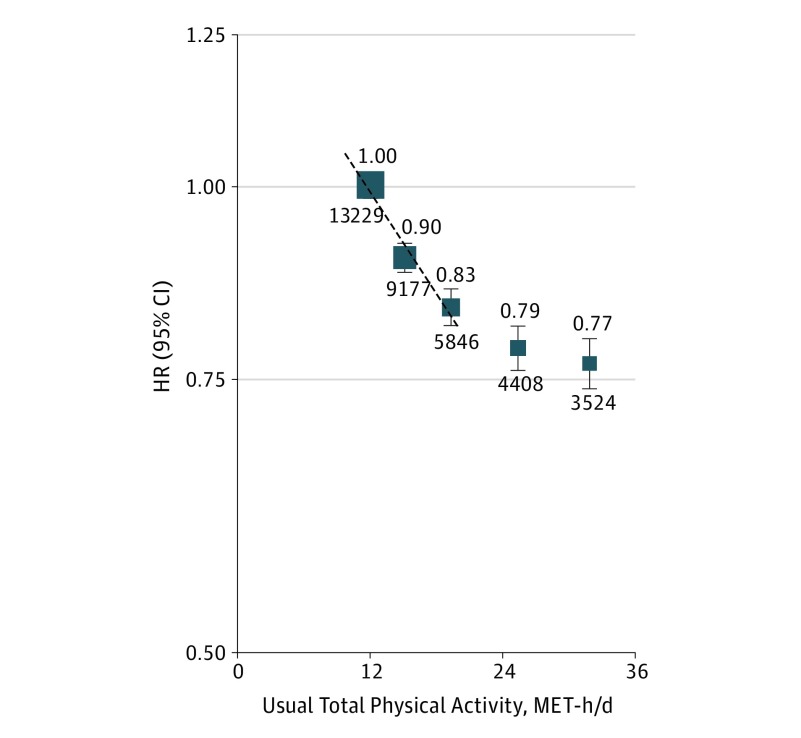
Figure 1. Adjusted Hazard Ratios (HRs) for Major Vascular Events by Total Physical Activity.
Values shown are the HR (95% CI) for major vascular events (n = 36 184) by quintiles of total physical activity after adjustment for age, sex, region, household income, education, alcohol consumption, smoking, fresh fruit intake, sedentary leisure time, and self-reported general health status. The size of the squares is proportional to the inverse variance of each effect size. The dashed line represents the slope from a weighted linear regression with weights based on the inverse variance of the log hazard ratios. The hazard ratio per 4 usual metabolic equivalent of task hours per day (MET-h/d) was 0.94 (95% CI, 0.93-0.95).

