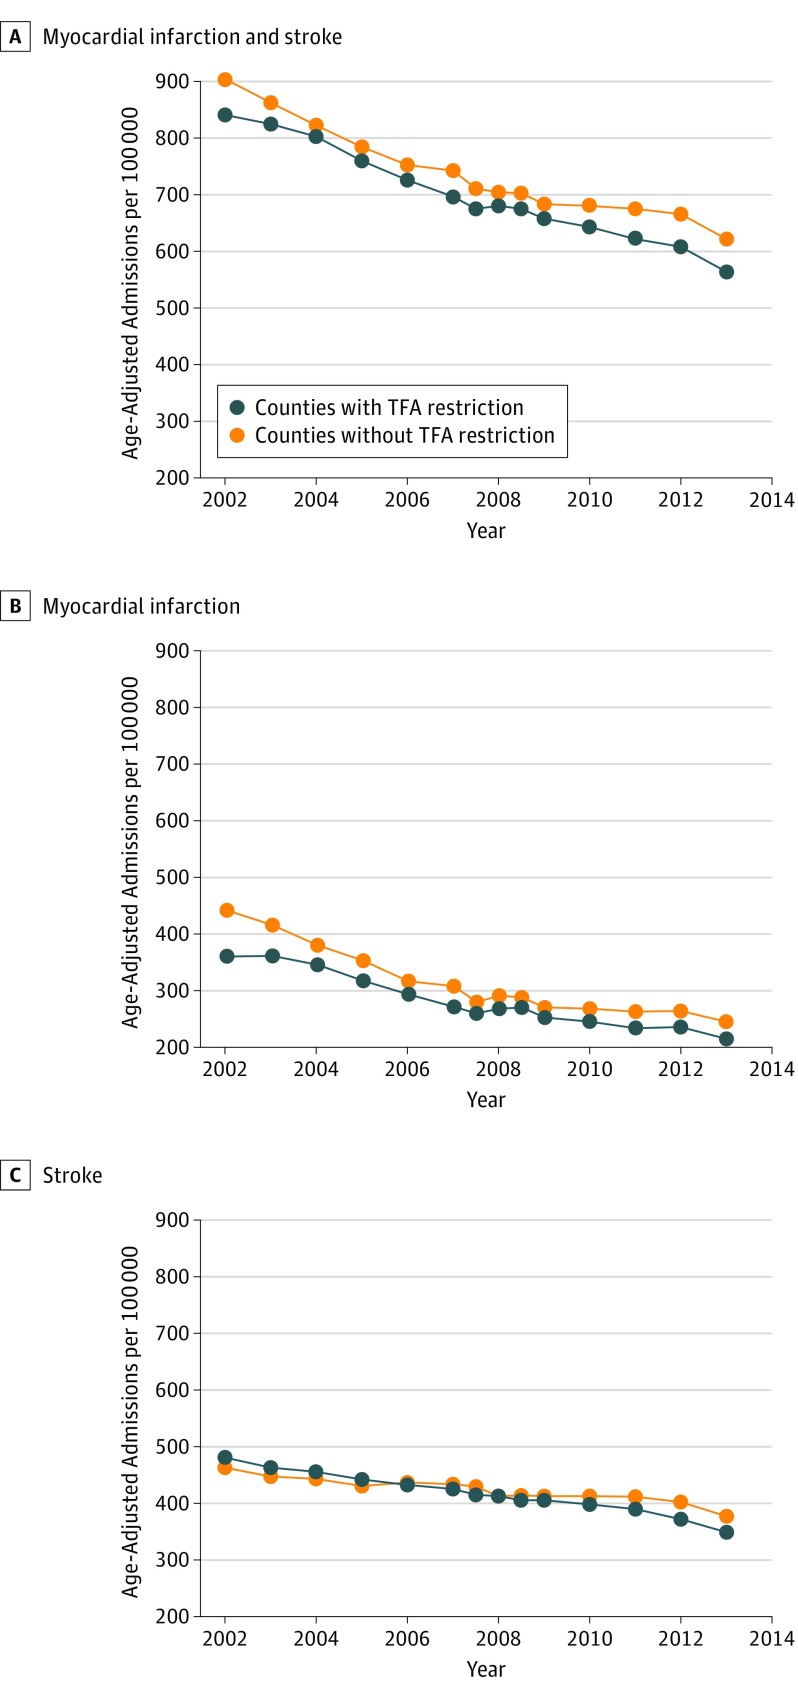
Figure 2. Temporal Trends in Myocardial Infarction and Stroke Event Rates in Urban Influence Codes 1 or 2 New York State Populations With and Without Subsequent Trans-Fatty Acid (TFA) Restrictions.
Each point corresponds to an annual admission rate. Years 2007 and 2008 have points corresponding to each half year during the period of multiple restriction implementations. Data are age-adjusted to the national population in 2010.

