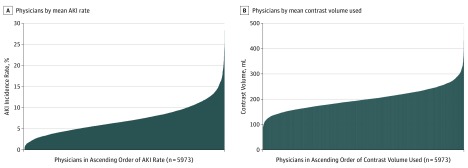
Figure 1. Variation in Acute Kidney Injury (AKI) Incidence Rate and Mean Contrast Volume per Percutaneous Coronary Intervention Among US Physicians.
A, Physicians (on the x-axis) are listed in ascending order according to their AKI rate, lowest to highest. B, Physicians (on the x-axis) are listed in ascending order according to their mean contrast volume used, lowest to highest.

