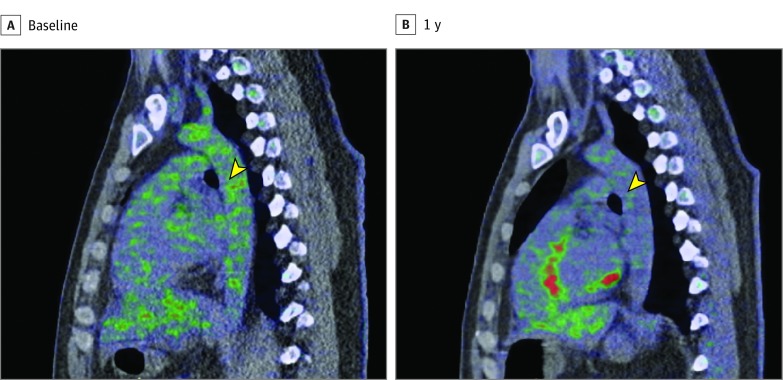
Figure 2. Patient With Improvement in Psoriasis Severity and Aortic Vascular Inflammation.
Representative images from a patient who experienced reduction in both Psoriasis Area and Severity Index score and aortic vascular inflammation. The images show a sagittal section at the level of the midaorta at baseline (A) and 1 year (B). Green represents 18fluorodeoxyglucose tracer uptake in the aorta, which is higher at baseline compared with 1 year of psoriasis treatment (yellow arrowheads).

