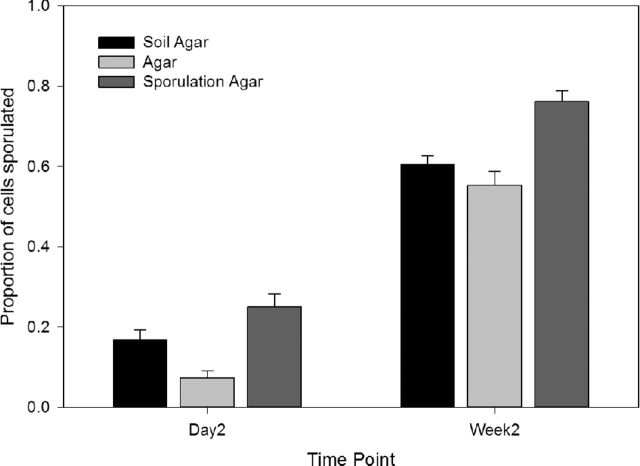
Figure 2.
The mean proportion of sporulated cells in each environment. The data for synthetic grape juice is not shown as no sporulation was observed for any S. cerevisiae genotype. The error bars represent the standard error around each mean. Sporulation proportions significantly differ across all environments at both time points (F2,92 = 39.8 and 28.5; both P < 0.0001).

