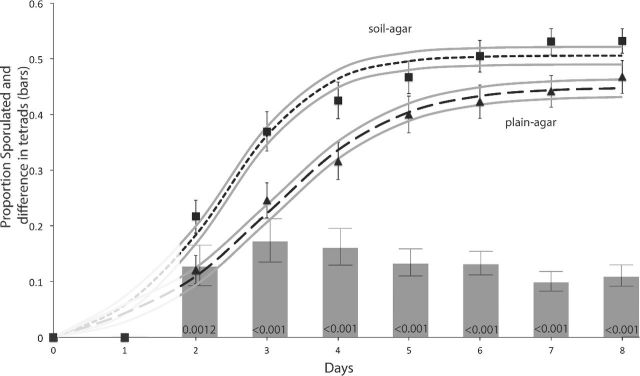
Figure 3.
Sporulation dynamics across eight days, showing the mean (± s.e.) in plain-agar (triangles) and soil-agar (squares) environments. The best-fit three-parameter asymptotic exponential model is shown for both: soil-agar = small dash; and plain-agar = long dash. The standard error for each curve is shown as light grey lines. The model is greyed out prior to 2 days as no sporulation was recorded. The histogram is at the same scale as the rest of the plot and shows the mean (± s.e.) difference in the proportion of tetrads between the two environments at each time point: the positive values show greater tetrad number of in the soil-agar environment. The probability values for t-tests evaluating whether the difference in tetrad proportions are different from zero (i.e. that tetrad proportions do not differ between plain- and soil-agar environments) are shown at the bottom of each bar and have been adjusted for multiple comparisons using the Benjamini–Hochberg method (Benjamini and Hochberg 1995).

