Figure 2.
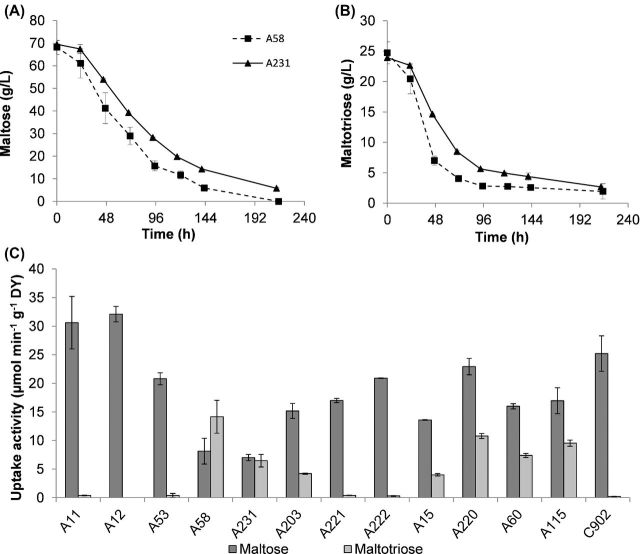
Time profile of (A) maltose and (B) maltotriose concentration (g L−1) of group I strains A58 and A231 throughout the fermentation. Values represent the mean of two independent fermentations and error bars the standard deviation. (C) Zero-trans rates of maltose and maltotriose uptake activity (μmol min−1 g−1 DY) of the strains in study, measured at 20°C. An uptake activity ≤0.5 μmol min−1 g−1 DY is considered negligible. Values are means of three independent assays, error bars represent standard deviation.

