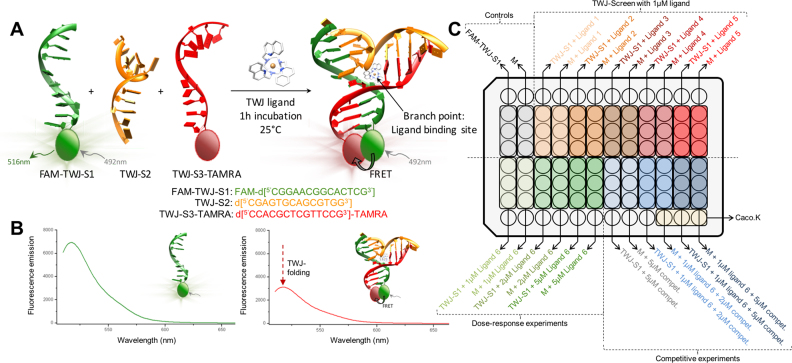
Figure 1.
(A) Schematic representation of the TWJ-Screen assay. (B) Representative examples of fluorescence spectra recorded during the assay (1 μM DNA, 5 μM ligand in 10 mM lithium cacodylate buffer (pH 7.2) + 10 mM KCl/90 mM LiCl, λex = 492 nm, λem = 505–675 nm). (C) Schematic representation of the 96-well plate organization of the TWJ Screen assay (basic mode, dose-response and competitive experiments).

