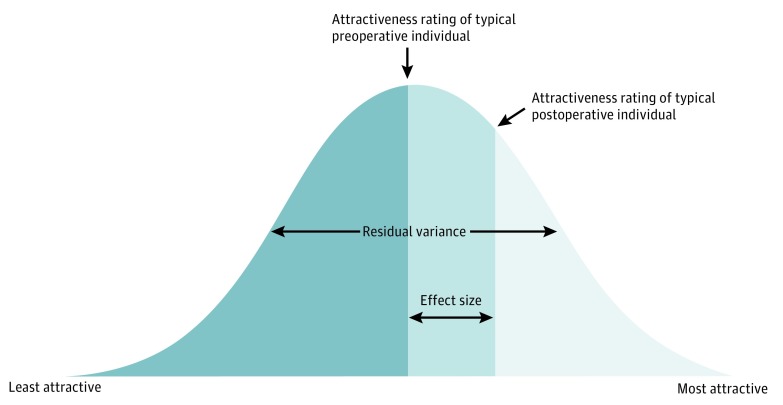
Figure 2. Pictorial Depiction of Ordinal Rank Change Calculation Using Attractiveness as an Example Domain.
The difference in area under the curve between the preoperative and postoperative groups (medium blue shading) represents the percentage shift in attractiveness after surgery. When applied to a group of 100 rank-ordered individuals, this value will be the number of people a typical individual will shift following face-lift and upper facial rejuvenation surgery in a given domain. The darkest blue shading represents 50% of the population based on preoperative attractiveness ratings.

