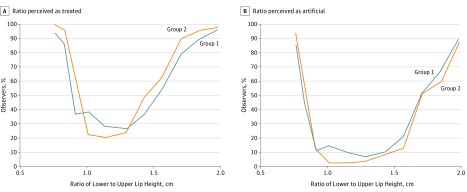
Figure 4. Effect of the Upper and Lower Lip Ratio on Perceptual Threshold.
A, Ratio of lower lip to upper lip heights that were perceived as treated. The blue line represents group 1 (mean age, 32.5 years; n = 49) and the orange line represents group 2 (mean age, 52 years; n = 49). B, Ratio of lower lip to upper lip heights that were perceived as artificial. The blue line represents group 1 and the orange line represents group 2.

