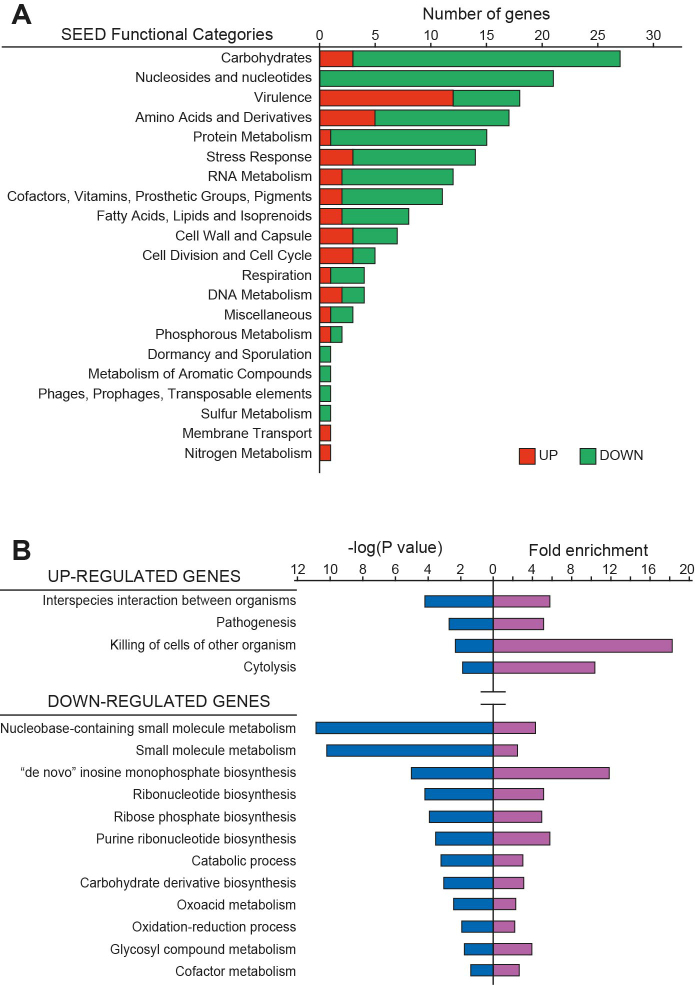
Figure 1.
Functional classification and analysis of proteins affected by cspA deletion. (A) The plot represents the number of detected up- and down-regulated proteins (red and green bars, respectively) that could be classified into different functional categories following the SEED database standards (http://pseed.theseed.org/) (38). (B) Gene Ontology Enrichment Analysis performed with the PANTHER Overrepresentation Test tool from the Gene Ontology Consortium (http://pantherdb.org) (39). P-value (represented as negative log) and fold enrichment of overrepresented functional categories (P-value < 0.05) are plotted. To simplify the plot, redundant categories were eliminated.

