Figure 2.
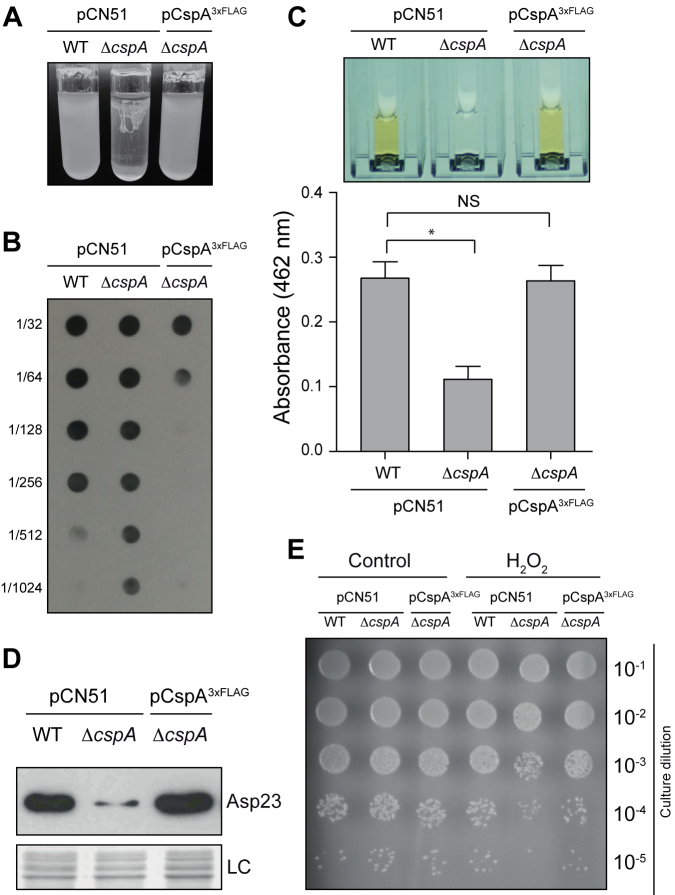
Phenotypic comparison of the WT, ΔcspA and complemented ΔcspA pCspA3xFLAG strains. (A) Bacterial aggregation phenotypes after incubation for 24 h at 250 rpm and 37°C in glass tubes containing 5 ml of TSBglu. (B) Dot-blot of PIA-PNAG exopolysaccharide for each of the strains in the previously mentioned conditions. Serial dilutions (1/2) of the samples were spotted onto nitrocellulose membranes and PIA-PNAG was developed with specific anti-PIA-PNAG antibodies. (C) Quantification of staphyloxhantin (STX) production. Bacteria were grown for 16 h at 250 rpm and 37°C. Column bars represent the mean levels of STX. Error bars indicate the standard deviation from three independent experiments. Asterisk indicates that STX level differences between WT versus ΔcspA are statistical significant (P-value = 0.0142). Cuvettes containing the extracted STX pigment are shown. (D) Asp23 protein levels. Total protein extraction was performed at mid-exponential phase after growth at 37°C and 200 rpm. The Western blot was developed using peroxidase conjugated anti-FLAG antibodies. A Coomassie stained gel portion is shown as loading control (LC). (E) Hydrogen peroxidase susceptibility assay. Bacterial plate growth from several ten-fold serial dilutions after treatment with a fixed concentration of H2O2. Bacteria were grown until late stationary phase at 37°C and 200 rpm, diluted to 5 × 10⁷ cfu ml−1 and challenged with 0.09% final concentration of H2O2 for 1 h in the same conditions. Non-treated bacteria were included as a control.

