Figure 3.
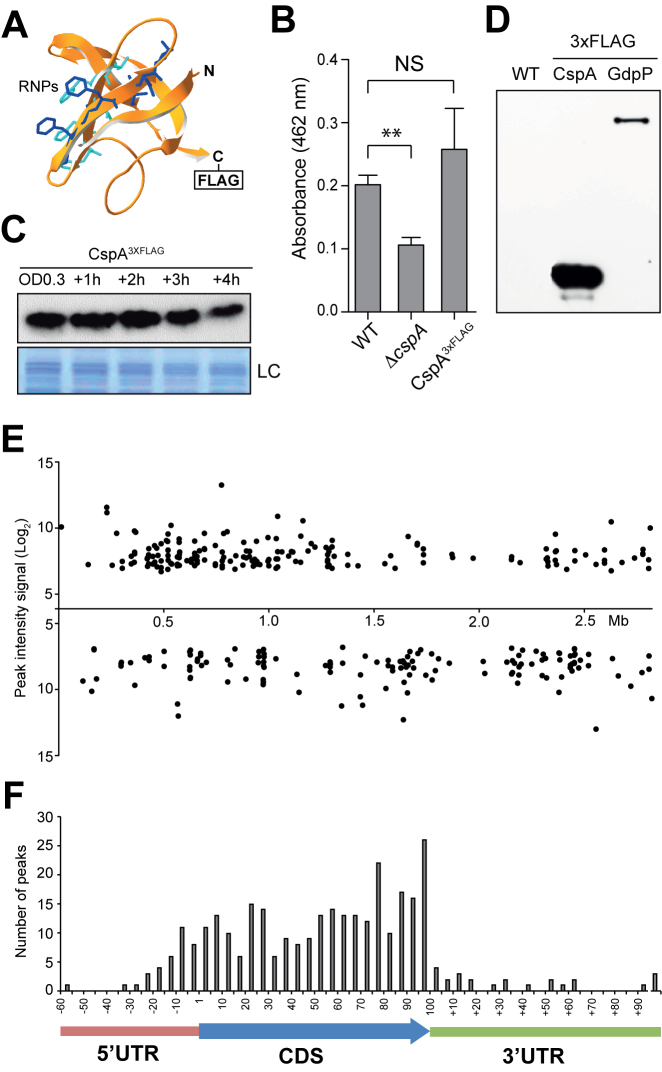
Expression analysis and RIP-on-chip assay of S. aureus CspA3xFLAG. (A) Putative S. aureus CspA protein structure, predicted by SWISS-MODEL (55), using B. subtilis CspB as a template (PDB ID 2ES2). Residues corresponding to RNA-binding domains RNP1 and RNP2 are showed in blue and cyan respectively. (B) Quantification of staphyloxhantin (STX) production. Column bars represent the mean levels of STX. Error bars indicate the standard deviation from three independent experiments. Asterisks represent that STX level differences of WT versus ΔcspA are statistically significant (P-value = 0.001) while NS indicates that differences between WT and CspA3xFLAG are not statistically significant (P-value = 0.379). (C) Chromosomal CspA3xFLAG protein expression profile along the growth curve. Protein samples were extracted when bacteria reached OD600nm 0.3 and +1, +2, +3 and +4 h later, after growth at 37°C and 200 rpm. The Western blot was developed using peroxidase conjugated anti-FLAG antibodies. A Coomassie stained gel portion is shown as loading control (LC). (D) CspA3xFLAG and GdpP3xFLAG protein pull-down control. Western blot of the precipitated fractions showing the presence of flagged proteins after RIP was performed. The result was developed using peroxidase conjugated anti-FLAG antibodies and a bioluminescence kit. (E) CspA binding peaks mapped along the S. aureus NCTC 8325 genome. Each dot represents the peak intensity signal for a specific genome position. F. Relative summit peak positions mapped onto an mRNA model. The length of CDS encoded by transcripts targeted by CspA were normalized to 100 and the summit positions were mapped accordingly. The number of relative summit positions mapping onto each 1/20 fraction of a CDS or outside of it were plotted.

