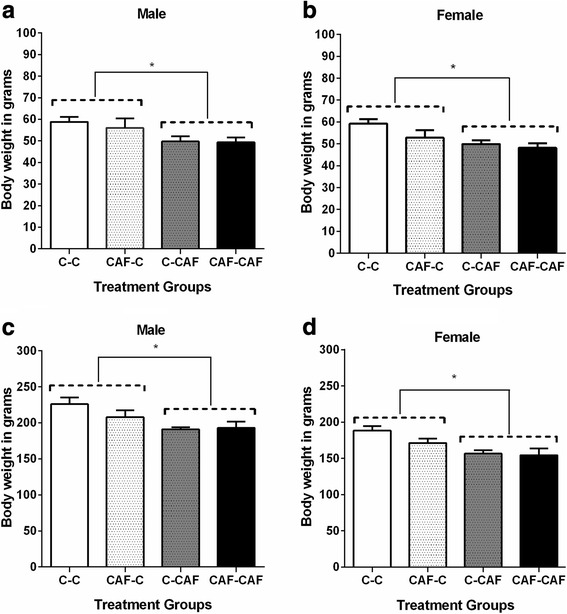
Fig. 2.

Body weight at weaning (a, b) and at 6 weeks of age (c, d) in male and female offspring exposed to a maternal cafeteria diet during the prenatal and/or suckling period. Values are expressed as mean ± SEM. * denotes significant differences between treatment groups (P < 0.05) (3 weeks: C-C, n = 9, CAF-C, n = 5; C-CAF, n = 6 females, 4 males; CAF-CAF: n = 8; 6 weeks: C-C, n = 9, CAF-C, n = 6 females, 4 males; C-CAF n = 6 females, 4 males; CAF-CAF, n = 7)
