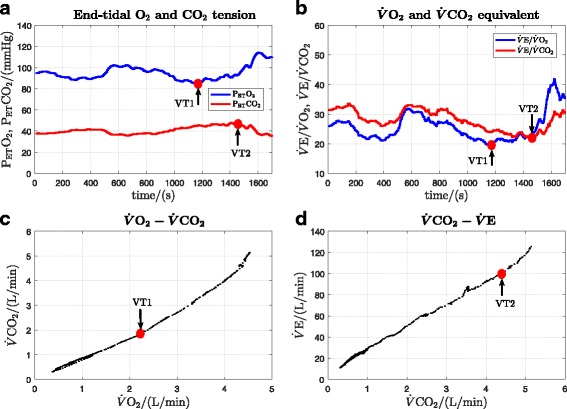
Fig. 5.

Original data record and determination of VT1 and VT2 thresholds for the CE data in Fig. 3 (participant 8). a VT1 is at the minimum point of P ETO2 and VT2 is at the turning point of P ETCO2. b VT1 is at the minimum point of and VT2 is the minimum point of . c VT1 is at the deflection point of vs. (V-slope method). d VT2 is at the deflection point of vs.
