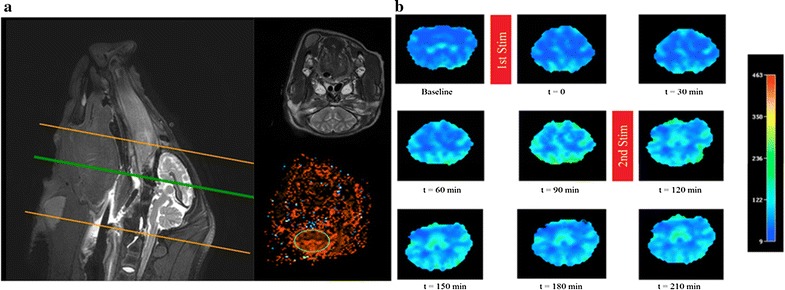
Fig. 2.

An example of the cerebral blood flow response to magnetic facial nerve stimulation in the pig. a MRI T2 weighted image used as an anatomical reference (top) for ROI placement (bottom). b MRI perfusion images ordered temporally from left-to-right and top-to-bottom, with the intervening red bars demonstrating when the first and second stimulations were delivered. The example is a pig subject to repeated facial nerve stimulation with 1.9 Tesla power for 5 min. The oval ROI shown in a was created with Osirix software for quantification purposes; the manual segmentation shown in b was created with Philips software for graphical representation only
