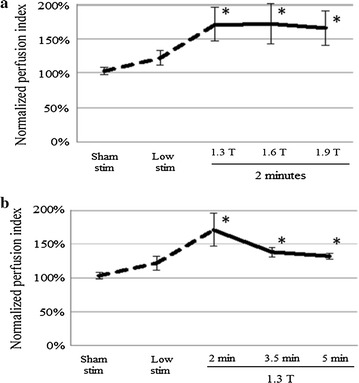
Fig. 5.

Cerebral blood flow responses to various combinations of magnetic facial nerve stimulation parameters in pigs—analysis including single stimulation experiments. a Effect of stimulation power; b effect of stimulation duration. First stimulation trial of the repeated stimulation experiments shown (n = 9 per group). Single stimulation experiments with sham stimulation (0.1 Tesla power for 30 s) or low stimulation (1.0 Tesla power for 1 min) parameters (n = 3 per group) included as dashed lines. Data from single stimulation and repeated stimulation trials are shown together to estimate the lower end of the dose–response curve, which is not seen when evaluating only the repeated stimulation trials as per Fig. 4. *P < 0.05 versus sham stim, paired t test corrected by the Bonferroni method for multiple comparisons. Mean ± SE
