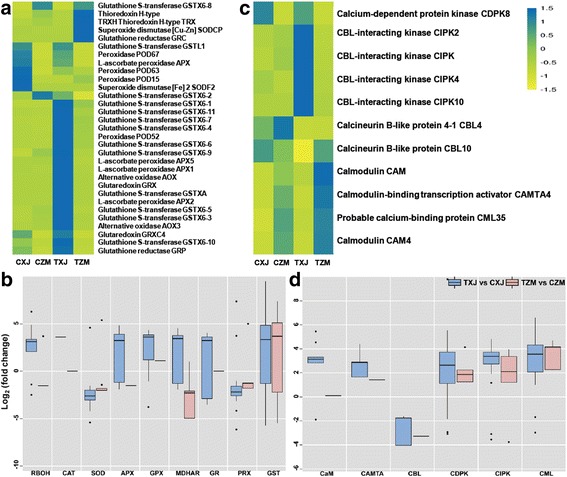
Fig. 4.

Expression of genes involved in second messenger signaling (ROS and Ca2+) in XJ and ZM. XJ and ZM were treated with salt solution (TXJ and TZM, respectively) or water (CZM and CXJ, respectively), and subsequently samples were collected on the seventh day. a Heatmap of the relative expression of the genes important for ROS catabolism. b Box plot indicating the expression changes of the genes involved in ROS homeostasis, in XJ and ZM, in response to salt treatment. c Heatmap of the relative expression of the genes important for Ca2+ downstream signaling. d Box plot indicating the expression changes of the salt-responsive genes involved in Ca2+ downstream signaling in XJ and ZM. Further detailed information is given in Additional file 2: Tables S4 and S5
