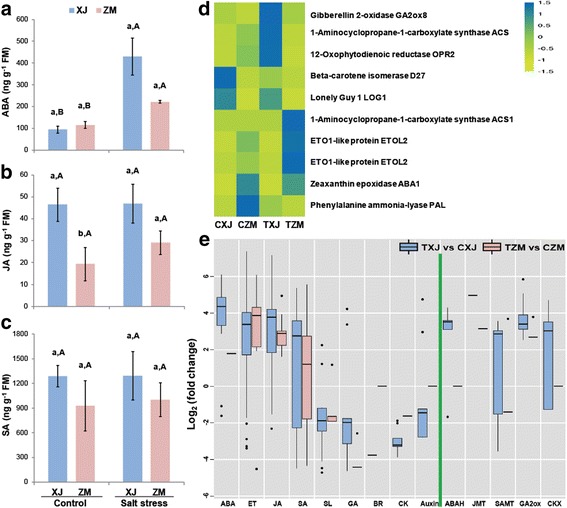
Fig. 5.

ABA, JA, and SA levels and expression of phytohormone biosynthetic genes in XJ and ZM. XJ and ZM were treated with salt solution (TXJ and TZM, respectively) or water (CZM and CXJ, respectively), and subsequently samples were collected on the seventh day. ABA (a), JA (b), and SA (c) levels in ZM and XJ cultivars (n = 5). All data are shown as mean ± standard error. Different lowercase letters represent significant differences between cultivars; different uppercase letters indicate significant differences between treatments (Tukey’s HSD test; P < 0.05). d Heatmap of the relative expression of the genes encoding phytohormone biosynthesis enzymes. e Box plot indicating the expression changes of the salt-responsive genes involved in phytohormone biosynthesis in XJ and ZM. Further detailed information is given in Additional file 2: Table S6
