
Fig. 3.
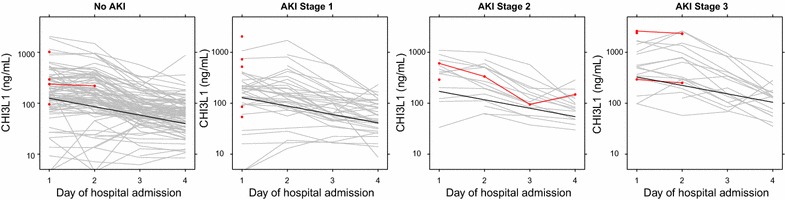
CHI3L1 levels are elevated over hospitalization according to the severity of acute kidney injury. Line plots showing individual CHI3L1 trajectories for patients according to the severity KDIGO-defined acute kidney injury (AKI). CHI3L1 levels for in-hospital mortality are depicted in red. The line for the linear mixed effects model is shown in black. Time, nitric oxide treatment arm, and AKI stage were entered as fixed effects. In this model, AKI grade 1, 2 and 3 was associated with CHI3L1 concentrations 1.02, 1.3, and 2.5-fold higher than patients without AKI, over the course of the first 3 days of hospitalization (p < 0.0001)