
Fig. 2.
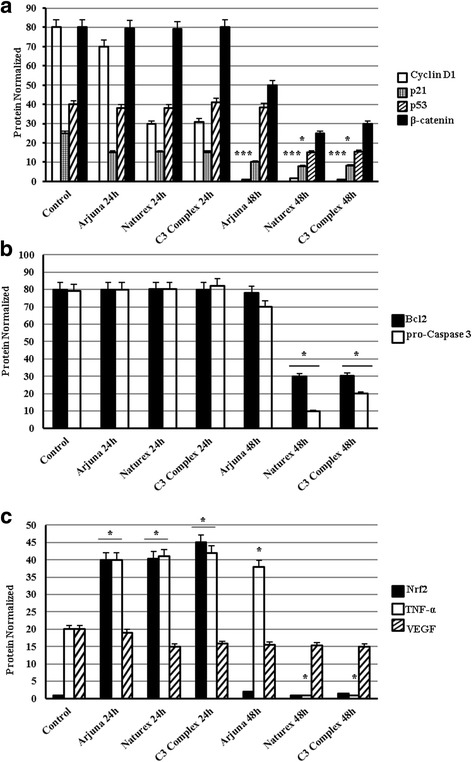
Western blot analysis of the expression level of Cyclin D1, p21, p53, β-Catenin (a), Bcl2, pro-Caspase3 (b), Nrf2, Tnf-α, VEGF (c) of cells pretreated with the three different extracts of Curcuma (Arjuna®, Naturex®, C3Complex®) with 25 μM for 24-48 h. Densitometric analysis of the western-blot bands was made using ImageJ software, and from the analysis it was obtained the histogram. β-Tubulin was monitored as a loading control. All data represent as the means ± SEM of three independent experiments. p < 0.05*, p < 0.01**, p < 0.001*** vs. the control (untreated cells) (ANOVA)