Figure 4.

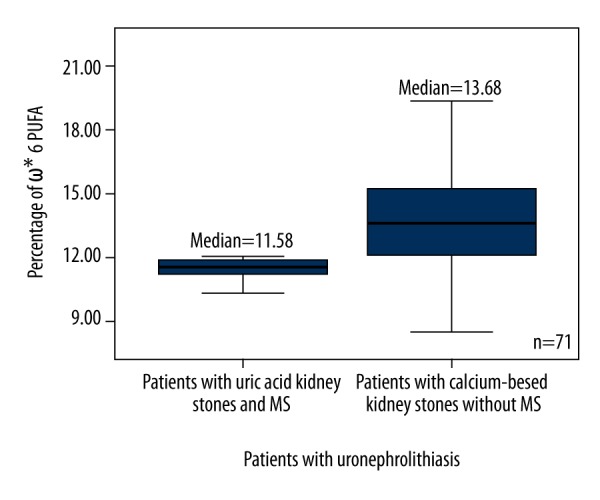
Box plots represent comparison of percentage of ω6 PUFA between patients with uric acid kidney stones and MS, and the patients with calcium-based kidney stones without MS. P=0.042. N=71. * – Omega; PUFA – polyunsaturated fatty acid.

Box plots represent comparison of percentage of ω6 PUFA between patients with uric acid kidney stones and MS, and the patients with calcium-based kidney stones without MS. P=0.042. N=71. * – Omega; PUFA – polyunsaturated fatty acid.