
Figure 6.
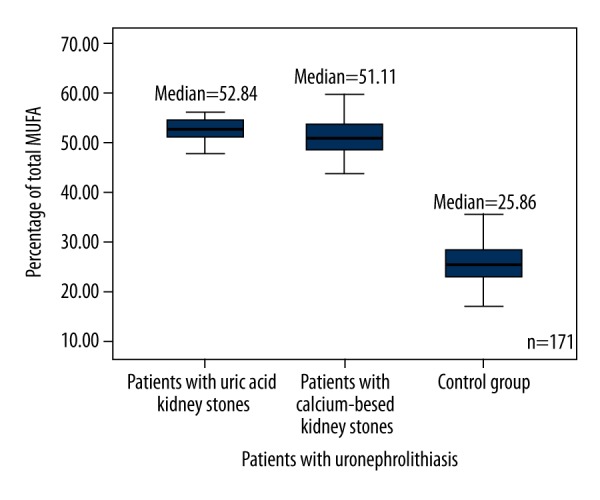
Box plots represent comparison of percentage of total MUFA between all groups of patients and the control group. P<0.0001. N=171. MUFA – monounsaturated fatty acids.
Official websites use .gov
A
.gov website belongs to an official
government organization in the United States.
Secure .gov websites use HTTPS
A lock (
) or https:// means you've safely
connected to the .gov website. Share sensitive
information only on official, secure websites.
Box plots represent comparison of percentage of total MUFA between all groups of patients and the control group. P<0.0001. N=171. MUFA – monounsaturated fatty acids.