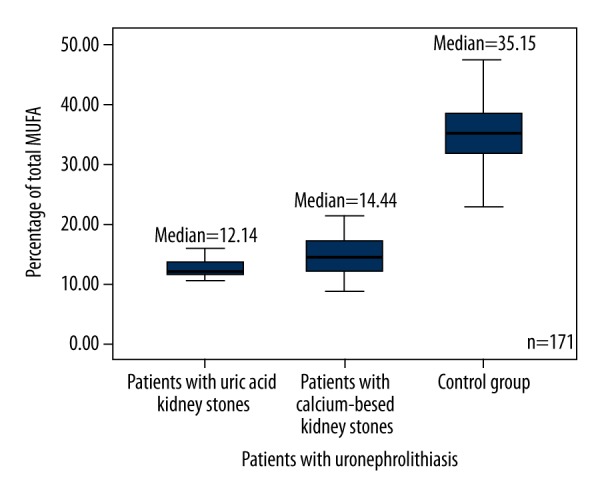
Figure 7.

Box plots represent comparison of percentage of total PUFA between all groups of patients and the control group. P<0.0001. N=171. PUFA – polyunsaturated fatty acid.

Box plots represent comparison of percentage of total PUFA between all groups of patients and the control group. P<0.0001. N=171. PUFA – polyunsaturated fatty acid.