
Fig. 7. Higher order correlation functions Cn, where 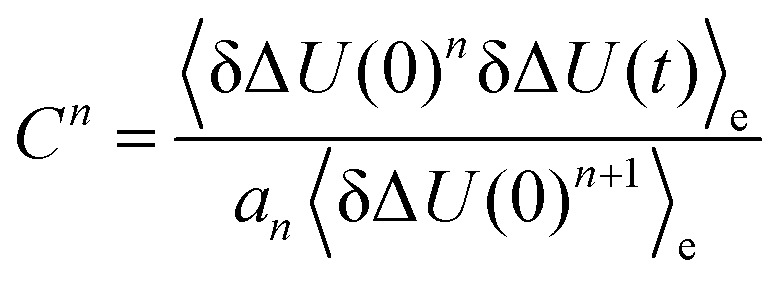 and a1 = 1, a2 = 1.6, a3 = 3, a4 = 6.4 and a5 = 15 according to eqn (5) after rearrangement. System: 2-PrOH for MQ (left) and C153 (right). The colored area corresponds to a 95% confidence interval.
