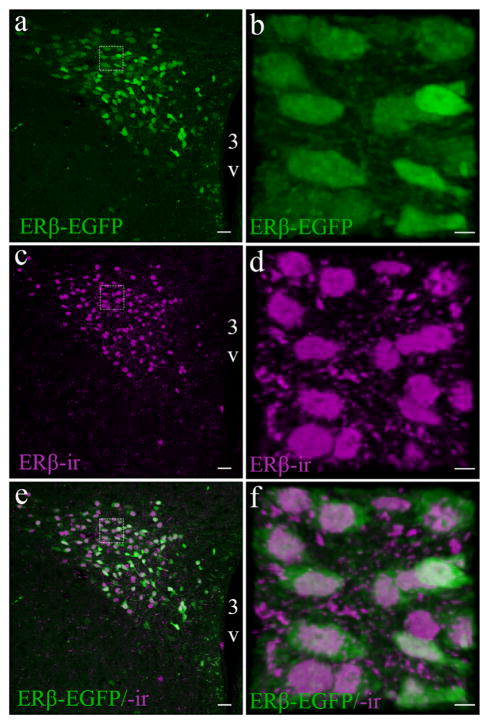
FIGURE 2.
Validation of the ERβ-EGFP mouse model for studying PVN ERβ expression. Representative confocal photomicrographs comparing the distribution of ERβ-EGFP in a female mouse (similar pattern is observed in males) (a) with ERβ-ir (c), using the Z8P antibody in the middle-caudal PVN. Enlarged images (b, d, f) shows a higher power view demonstrating the distribution of ERβ-EGFP (green) and ERβ-ir cells (magenta). And their colocalization (e, f). For all high power insets (dotted line box) the scale bar = 10 μm. Scale bars for all other images = 50 μm. 3V, Third ventricle [Color figure can be viewed at wileyonlinelibrary.com]

