FIGURE 4.
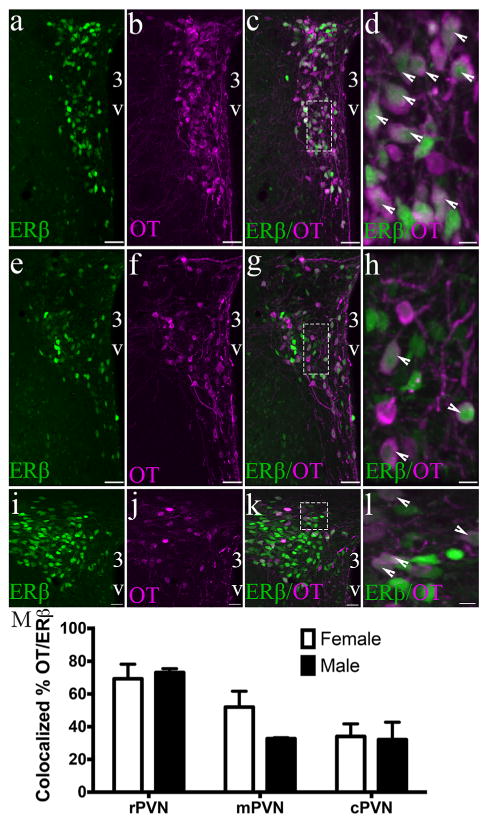
OT colocalizes with PVN ERβ-EGFP cells in an PVN region-specific manner. Representative confocal photomicrographs of a female ERβ-EGFP mouse showing rostral (a–d), middle (e–h), and caudal (i–l) PVN oxytocin (OT) immunoreactivity and ERβ-EGFP (n = 3/sex). Bar graph (m) show the mean percentage colocalization of OT in ERβ-EGFP neurons in the rPVN, mPVP, and rPVN of male and female mice (m). % colocalization = number of OT-ir neurons/total number of ERβ neurons in selected region × 100. Data are expressed as mean percentage ± SEM. For all higher power (dotted line box) images (d, h, l) the scale bar = 10 μm. Scale bars for all other images = 50 μm. 3V, Third ventricle. Arrowheads show examples of double labeled cells [Color figure can be viewed at wileyonlinelibrary.com]

