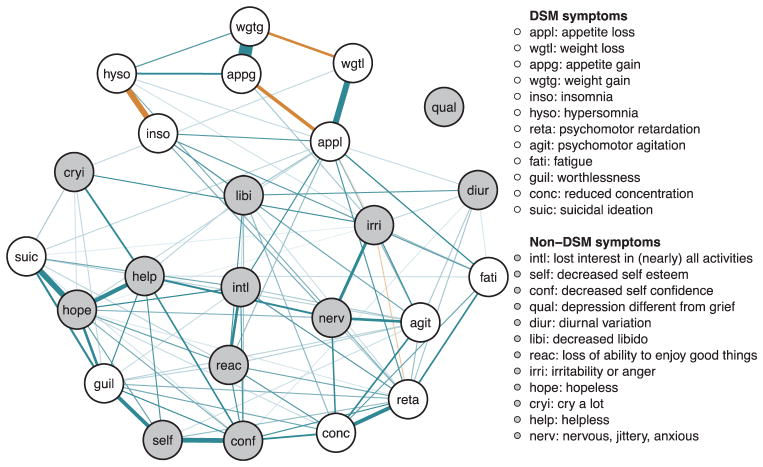
Fig. 2. Estimated regularized symptom network for the full sample (n = 5784).
Green edges indicate positive (partial) associations; red edges indicate negative associations. Thicker/darker lines indicate stronger associations. (For interpretation of the references to color in this figure legend, the reader is referred to the web version of this article.)

