
Figure 1.
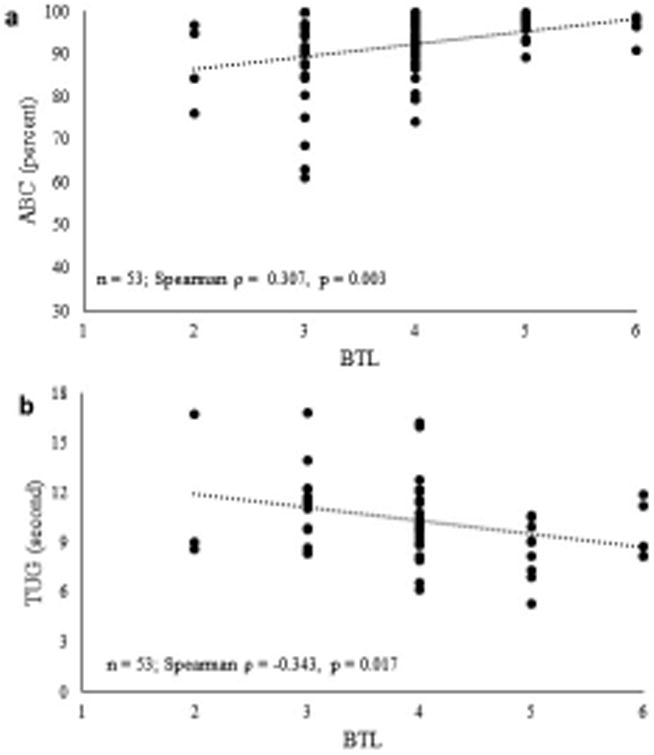
a. Scatterplot showing relationship between balance tolerance limit (BTL) and activities-specific balance confidence questionnaire (ABC); n = 93
b. Scatterplot showing relationship between balance tolerance limit (BTL) and timed up-and-go performance (TUG); n = 53