
Figure 2.
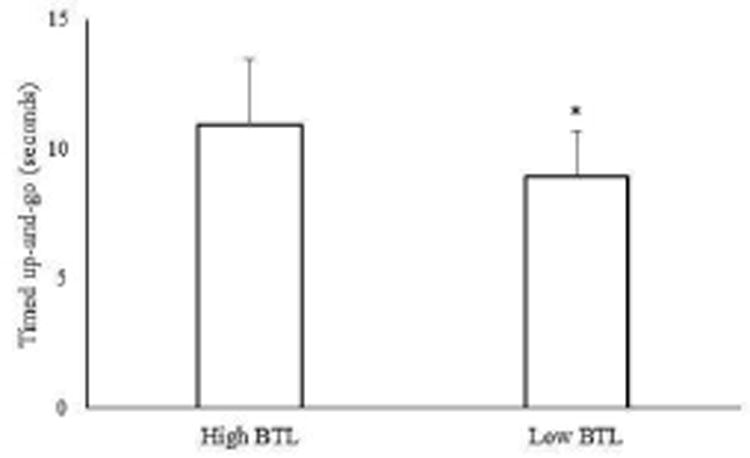
Timed up-and-go performance in individuals with low (n = 38) and high (n =15) balance tolerance limit (BTL). Means and standard deviations for each group are shown in the above figure. *Group difference, p < 0.05
Official websites use .gov
A
.gov website belongs to an official
government organization in the United States.
Secure .gov websites use HTTPS
A lock (
) or https:// means you've safely
connected to the .gov website. Share sensitive
information only on official, secure websites.
Timed up-and-go performance in individuals with low (n = 38) and high (n =15) balance tolerance limit (BTL). Means and standard deviations for each group are shown in the above figure. *Group difference, p < 0.05