
Figure 4.
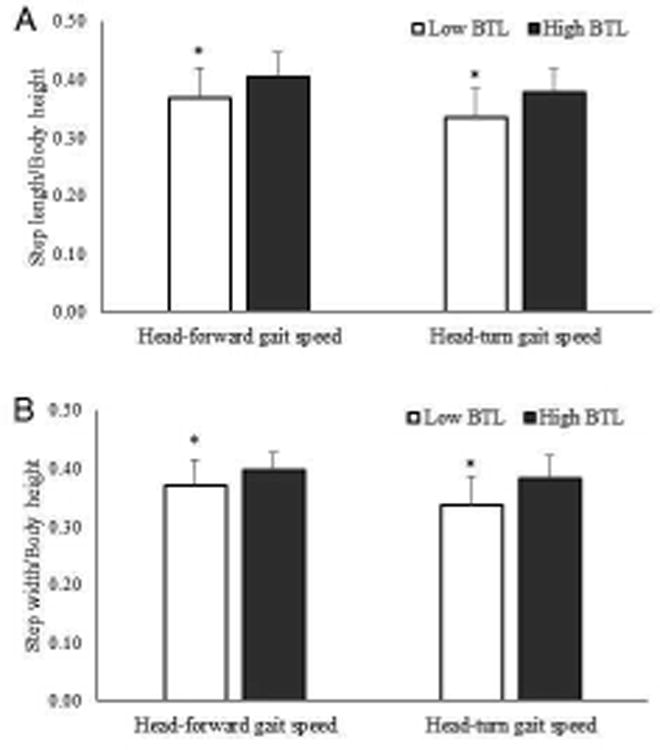
Difference in A) step length/body height and B) step width/body height in individuals with low (n = 74) versus high (n = 19) balance tolerance limit (BTL). Means and standard deviations for each group are shown in the above figure. *Group difference, p < 0.05